Report - Manager
The report manager summarizes all possible statistical evaluations. Unlike the statistical evaluations that are generated automatically, the report manager lets you custom-create individual reports using all of the available basic components. You can export them into different file formats, or send them by e-mail. Users may sort and filter information according to their interests, to structure (for example) statistics about internal system conditions. These may be used to structure the results of the process of sending newsletters, for faster sending. This leads to higher flexibility in the choice and composition of statistical evaluations. Many different reports can be created and saved; there is no specific maximum number of reports.
The functions of the report manager will be further described below.
The Report Manager can be found under menu item “Statistics”:
11-MenueStatistik.jpg)
Abb 12.1.1 - Menüübersicht Statistik
Open the report manager, by using either the submenu item or the choice in the Main Menu. This will show you the following processing view:
12-ReportManager.jpg)
Abb. 12.1.2 - Report Manager (Auslieferungszustand)
The reports represented in this illustration are provided preconfigured in the delivery status. They consist of samples and suggestions for creating your own reports, which can be used immediately. Of course these can also be further modified or reconfigured. In these preconfigured reports, you will have the following possibilities for processing:
 (Edit) : Clicking on this symbol will open the selected report in a separate window, where it may be edited. (Also see, “Edit a report.”)
13-ReportEditieren.jpg)
Abb. 12.1.3 - Editieren eines bestehenden Reports
 (Delete) : Clicking on this symbol will open the following query:
14-ReportLoeschen.jpg)
Abb. 12.1.4 - Löschen eines bestehenden Reports
After you click on the Delete-button the following confirmation information will be displayed:
15-ReportBestaetigungLoeschen.jpg)
Abb. 12.1.5 - Bestätigung über das Löschen eines Reports
 (View): After you select this symbol, you will see a report open in a separate window. The report viewer displays all the templates configured so far, and their version type (this may be seen in the upper righthand corner). Every component configured for the selected template is also listed. Each component starts with an indicator strip in grey, the component name, and the report name (on the left). The date and time of the current version of the report appear on the right.
16-ReportAnsehen.jpg)
Abb. 12.1.6 - Report ansehen
NOTE: No settings may be changed in this view. Please close this view using the  -button.
 (Send Out): After you select this symbol, the report you have chosen is automatically sent to the e-mail addresses predefined in the appropriate report-manager template. A confirmation message immediately appears, including the e-mail addresses the report was sent to.
17-ReportVersendet.jpg)
Abb. 12.1.7 - Report Versandbestätigung
 : Selecting this button opens the editor of the Report Manager. A new report may now be created.
: Selecting this button will return you to the main menu, “Statistics.”
Create a new report
: Selecting this button will open an empty report in the editor. All of the data existing in the database may be selected here in the form of components. Even the output format may be defined here.
18-ReportNeuLeer.jpg)
Abb. 12.1.8 - Erstellen eines neuen Reports
Start with the settings before you begin creating the report. Settings (index tab “Settings”) of the new report template:
.jpg)
» Template Name: to be named at will.
» Generating Statistics (Select Box):
setting of the chronological generation of the report. This is valid for the moment on which the user clicks the button to use or see the report. The following options are given as values for the generation time:
» Cache time of generation in real time:
Here you can define how long the selected report will be delayed before a new one is produced. This means that if a user generates this report, the report will be stored intermediately within the cache time, and must not be produced again within this time. The result is that the report may be called up more quickly. This function is only needed if real-time generation is configured, because otherwise the report is created and saved at a fixed point in time.
» Default format for sending e-mails:
The report may be generated in three different formats:
19-ReportBeispielHTML.jpg)
Abb. 12.1.9 - Beispielanzeige HTML
110-ReportBeispielPDF.jpg)
Abb. 12.1.10 - Beispielanzeige PDF
111-ReportBeispielExcel.jpg)
Abb. 12.1.11 - Beispielanzeige Excel
» Automatic sending of e-mails:
generated e-mails may be sent out automatically. The following functions are may be selected:
» List of recipients:
After you have selected automatic sending, the e-mail addresses that the report should be sent to must be entered here. (Note: If more than one e-mail address is entered, they need to be entered line by line (one in each line).
After you have finished the settings for this report, you may now select the components (images/graphics) that should be used for the statistics.
(Index tab: “Components” of the new report)
112-ReportKomponenten.jpg)
Abb. 12.1.12 - Report Komponenten
The components refer to the information that can be retrieved by BACKCLICK. For example: Using the component “registrations,” all the information BACKCLICK can find about subscriber registrations in the system will be displayed. The user may configure the output type here. If for example the component “registration” is added to a report (by selecting “registration,” and then clicking on the (add)-button), a preview is displayed showing the expected output. Many components may be inserted at will, but remember: The more information displayed in a report, the longer the production will last.
After you have inserted a component, there are two possibilities for further processing. These are indicated in the processing strip that appears in grey above the displayed preview. The name for every newly inserted component is also shown, in square brackets. This grey processing strip can only be seen in the processing view. Otherwise, information about the selected template or the component is shown in this strip. (Also see: “View.”)
1. Possibility: Work on: The settings of the component may be checked and changed if needed here. (Example: “Subscriptions”)
113-ReportKompoEinstBearbeiten.jpg)
Abb. 12.1.13 - Report-Komponenten bearbeiten
After you have clicked on the Edit-button, the editor for the components will be opened in a separate window: (Example: “Subscriptions”)
114-ReportKompoEditorEinst.jpg)
Abb. 12.1.14 - Report bearbeiten (Editoransicht)
In the general settings, the component assigned to the report can be named now. The type of graphical display can also be chosen here. Up to five different graphical types, depending on the components, may be chosen from the select box at your disposal:
1141-ReportBeispielBalken.jpg)
Abb. 12.1.14.1 - Beispiel Balkendiagramm
1142-ReportBeispielTorte.jpg)
Abb. 12.1.14.2 - Beispiel Tortendiagramm
1143-ReportBeispielTabelle.jpg)
Abb. 12.1.14.3 - Beispiel Tabelle (Excel)
1144-ReportBeispielLinie.jpg)
Abb. 12.1.14.4 - Beispiel Liniendiagramm
11445-ReportBeispielStack.jpg)
Abb. 12.1.14.5 - Beispiel Stackdiagramm
Every selection will be displayed as a preview (Preview ONLY SAMPLE) in the lower area of the window.
Settings for parameters of the component may be changed under the respective index tabs: (Example: “Subscriptions”)
115-ReportEditorKompopara.jpg)
Abb. 12.1.15 - Reporteditor Komponentenparameter
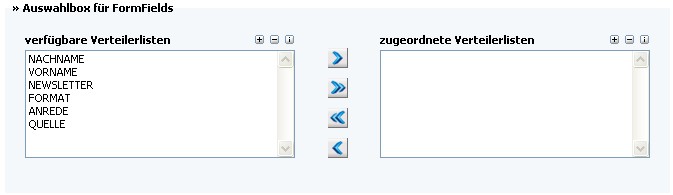
» Select mailing list:
All mailing lists that are assigned to the current user in the management of rights are shown as available mailing lists and can be used for producing or creating statistics. The arrows between the available and assigned distribution lists are needed for the assignment, or for dissolving an assignment. Only assigned mailing lists can be evaluated.
Assigned functions of the arrow keys:
 : Single selected, available mailing lists are assigned.
 : Single selected, available assignments are dissolved.
 : All available mailing lists are assigned.
 : All available assignments are dissolved.
» Select type of activity:
Under type of activity, all the ways to register in the system (for example) are shown.
The arrows control assignments as well as the dissolvings:
: Single selected, available mailing lists are assigned.
: Single selected, available assignments are dissolved.
: All available mailing lists are assigned.
: All available assignments are dissolved.
» Select range of time:
The range of time may be defined dynamically or fixed on a date where the subscribers have registered. The report ONLY shows the results of this range of time.
There are different parameters selectable that may be selected for the different components:
If you select one or more form fields, the content of the fields will be classified, and the entered information will be displayed statistically. The report is given in percentage values (see “Select percent”).

Percentages may be between 1% and 100%. After you have selected a value here, all the data below the selected value will no longer be shown in the results. If you want all the results to be displayed in the report, select “no restriction.”
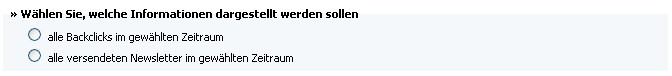
Select whether all the “back clicks” should be displayed, or if all of the newsletters should be shown. It is not possible to “select all.”
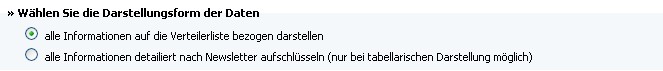
Choose between the values of the mailing list or the values of the newsletter. It is not possible to “select all.”
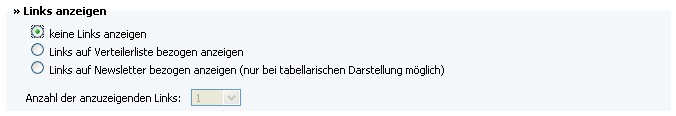
A display of links may be shown for the mailing list or for the newsletters; or else no display of links may be shown. It is not possible to “select all.” The number of links may be raised up to 20 as soon as a displaying option for links has been chosen.
If the settings of a component are complete, and the configuration must be saved, click on the 'Übernehmen'-button. The settings may only be saved if all the settings have been done correctly. If this is not the case, an error message will be shown, as long as there is a mistake in the configuration. The Editor will be closed after all of the settings have been entered correctly, and the corrections and settings will be stored in the system.
'Zurück': You will return to the processing view of the report Editor without saving data or changes. Of course, it is also possible to end the view by closing the current window.
2. Delete:Components that have been added may be deleted here.
116-EditorKompoLoeschen.jpg)
Abb. 12.1.16 - Report-Komponente Löschen
After you click on this button, the window will automatically close without providing any further information.
3. Save: End the work on the component and save the changes.
117-ReportEditorSpeichern.jpg)
Abb. 12.1.17 - Report-Einstellungen speichern
After you click on this  -button, all of the changes in the configuration or settings of this component will be saved in the system. The report will then be closed. If the window is closed manually before saving, all of the settings will be lost.
Edit a Report:
When you click on the “Edit” button, the selected report will be opened in a separate window. In this processing view, all of the already configured settings may be changed. New components may be added, and old ones may be deleted. (Example “Subscriptions”)
118-ReportEditorEditieren.jpg)
Abb. 12.1.18 - Report-Editor Editieren
To create a new report, click on the -button and select all the components you will need for your results later on.
|
Copyright (c) 2003-2011 ATD GmbH.
|
  |
|
What do you think about this topic? Send feedback!
|


