Using BACKCLICK you are able to evaluate subscribers response to your newsletters and use this data for future campaigns. To do so every hyperlink and all pictures or graphics will be modified to hyperlinks measurable by BACKCLICK. This feature may be activated or deactivated for every mailing list as needed.
What exactly will be measured?
BACKCLICK generates unique hyperlinks for every subscriber of each mailing. These hyperlinks are encoded and forgery-proof by means of check-sum procedures. This way BACKCLICK is able to track a click on a hyperlink or image in a newsletter all the way down to the individual subscriber. Explicit permission of every subscriber is required. Error sources like proxy servers or browser cache are completely avoided. This statistic is as accurate as possible.
Furthermore, BACKCLICK will create a so called tracking pixel for each HTML newsletter, if configured. This is an invisible image used to count the subscribers opening your newsletters. This procedure is also called coverage audit or opening statistic. Noumerous error sources cannot be avoided, influencing accuracy of this measurement. For example, email clients like Outlook or AOL prevent images from beeing displayed automatically in HTML newsletters. Opening rate seems to be lower than it actually is. On the other hand, features like automatic preview in email applications show an email although the recipient may not have noticed it, supposedly increasing the opening rate.
Feed-Links
BACKCLICK enables you to create so called feedlinks, which are hyperlinks containing specific subscriber data. For example, if you want to refer to a product from your online shop in your newsletter, you are able to transfer the customer ID or email address within the hyperlink. The advantage of this procedure is that no information is hard-coded in your hyperlink, but will be added when the subscribers clicks the link. Data will always be correct, even if the subscriber changed his information.
Example: http://www.test.com/shop.php?EMAIL=$$EMAIL$$&CID=$$CID$$&ARTICLE=12345
Go to Statistics --> Backclick - Statistics in order to see a summary of this data. You will see a table with the newsletter sent last for each of you mailing lists.
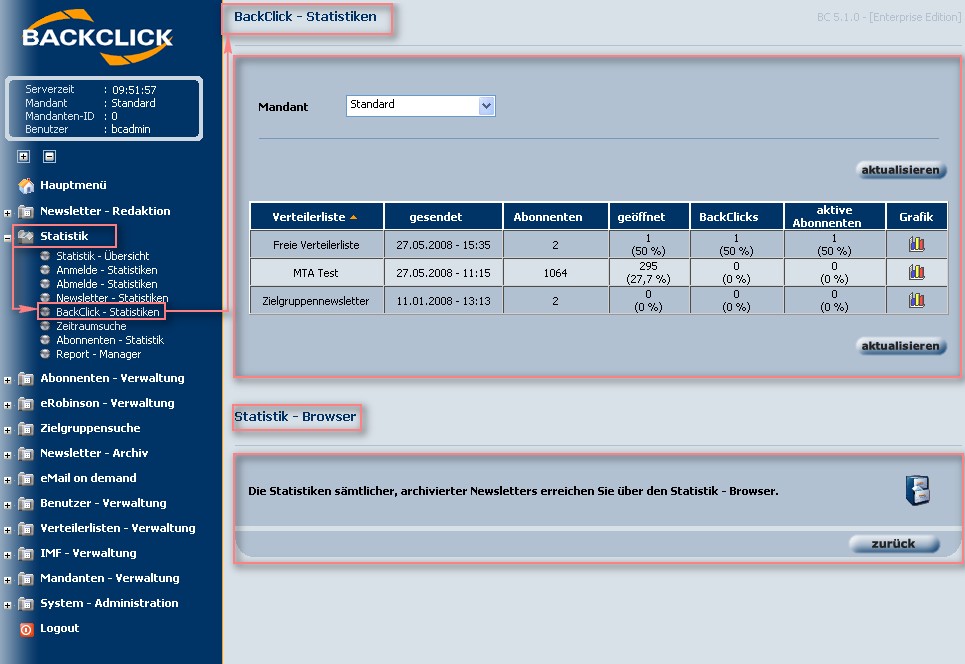
Fig. 3.8.1 - Backclick - Statistics
For further information and a visual presentation of each campaign click the  -button in the corresponding line. This will open a detailed description containing reaction data about every hyperlink. On top of that you will see several graphics depicting reaction of your subscribers (clicks).
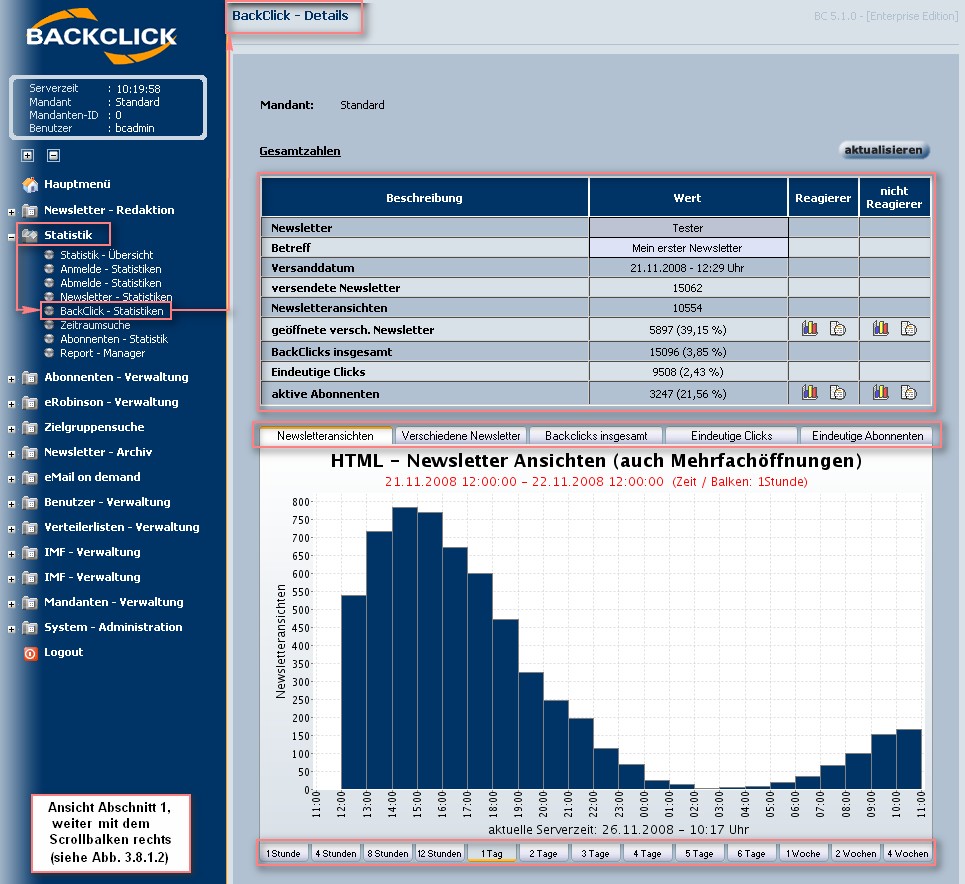
Fig. 3.8.1.1 - Backclick - Statistics detailed
You will also find detailed lists with data about reactions/clicks for 'Unique openings' and 'Unique subscribers'. Clicking the -button will open a separate window with a list of statistical data,
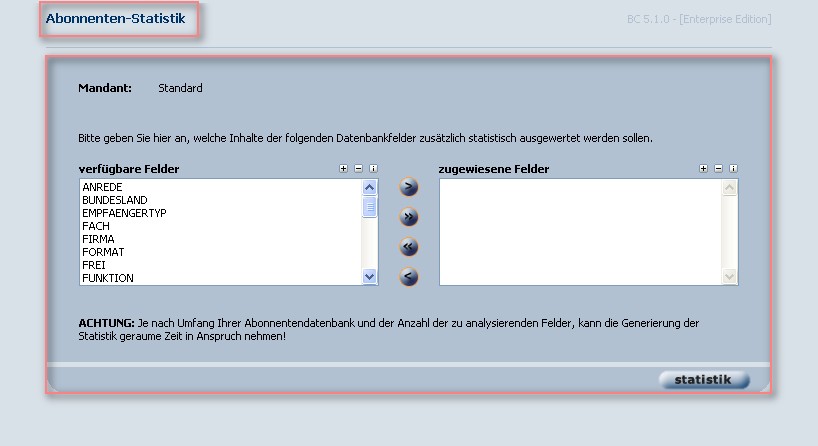
where you may choose which data to show. Mark the FIELDS to be filled with data. For example:
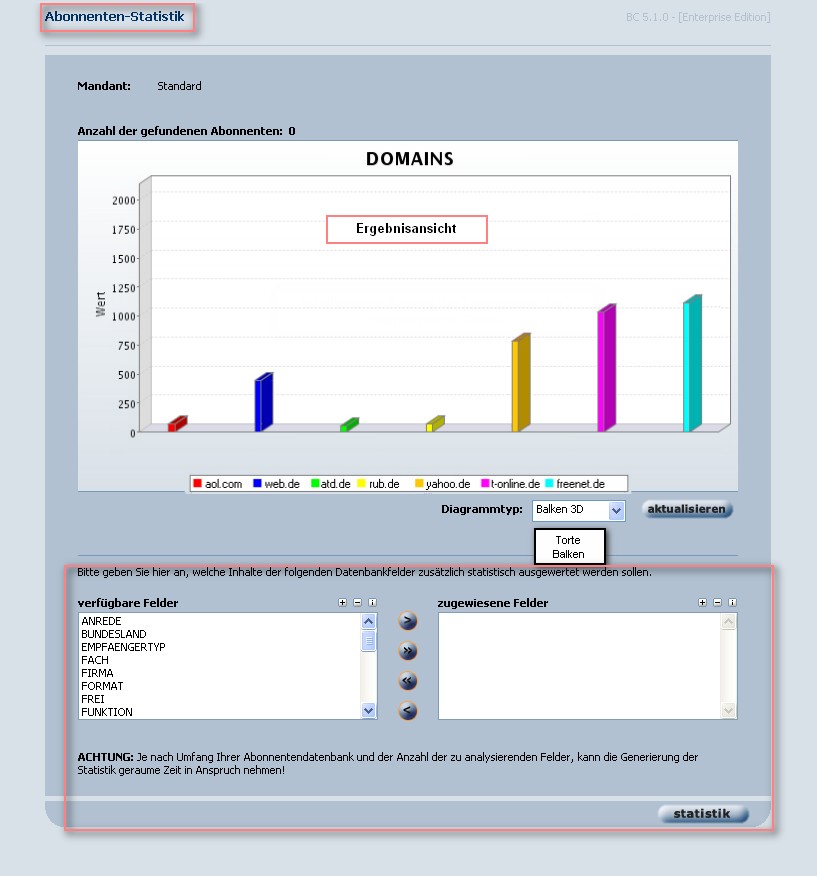
If you need additional data than the report you just created contains, all you have to do is choose the data field(s) you need at the bottom and click the "Statistic" button. The newly created statistic will be shown in the same window.
Then there is the history ( ),
),
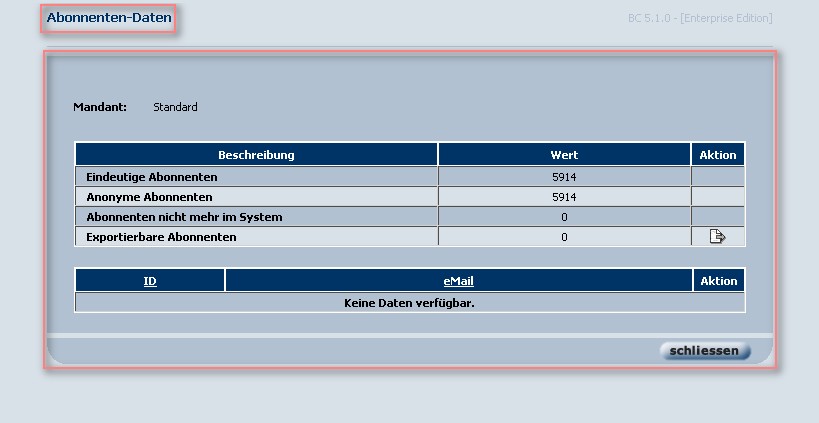
(You will not see any email addresses here, because this has been defined for the respective mailing list, email addresses cannot be exported either)
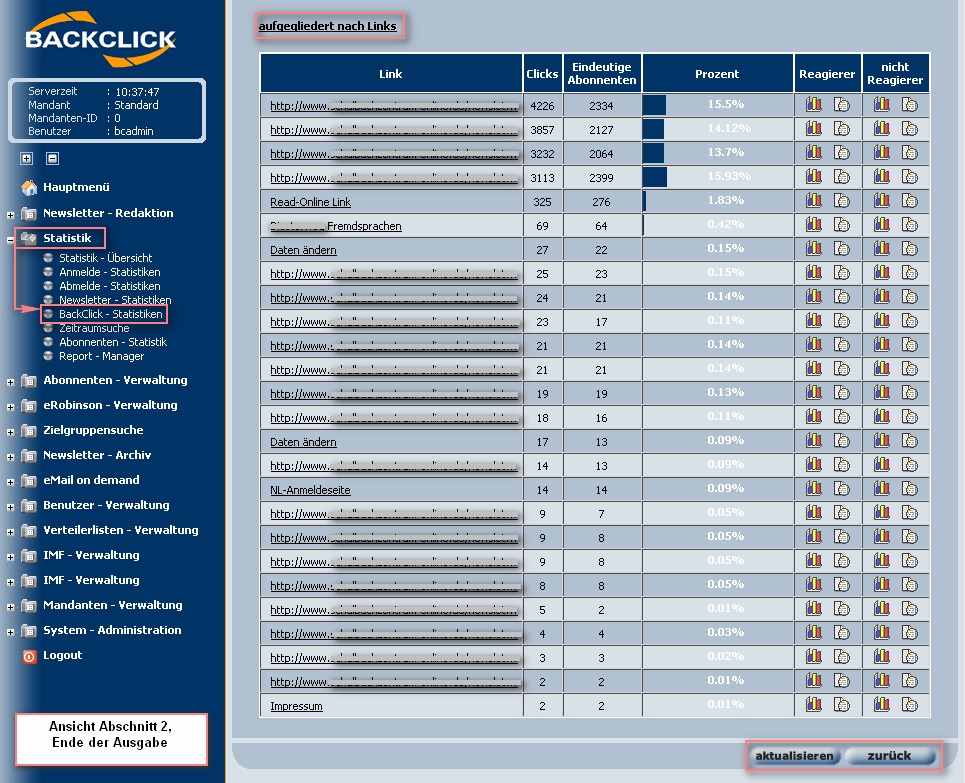
Fig. 3.8.1.2 - Backclick - Statistics
If this view was opened for a period of time, latest statistical information may be retrieved automatically with a click on the "Update"-button. To return to the menu Statistics, click the "back"-button.
It is also possible to receive a report of your data sorted in link categories previously defined. Please refer to the chapter Link - Categories for further information.
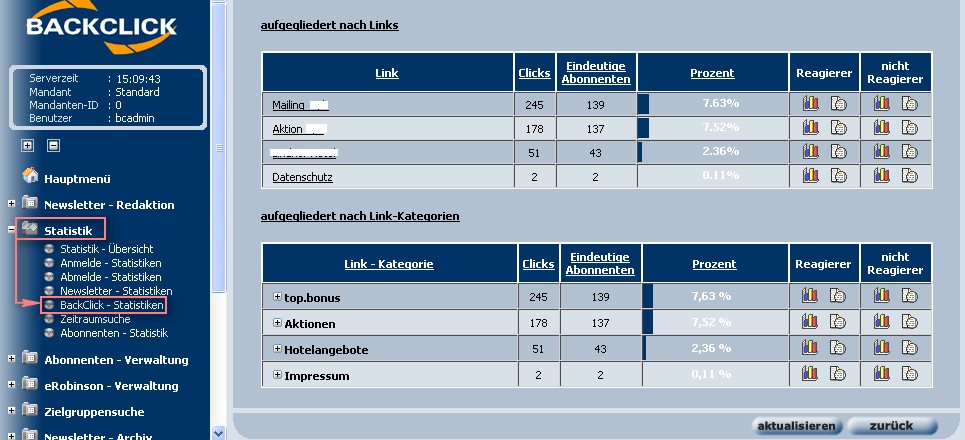
Fig. 3.8.2 - Sorting by Link-Categories
Statistics-Browser
Statistics - Browser contains all saved newsletters previously sent. Clicking the  -symbol opens a tree structure. Every newsletter sent together with its sending date will be listed, sorted by mailing list.
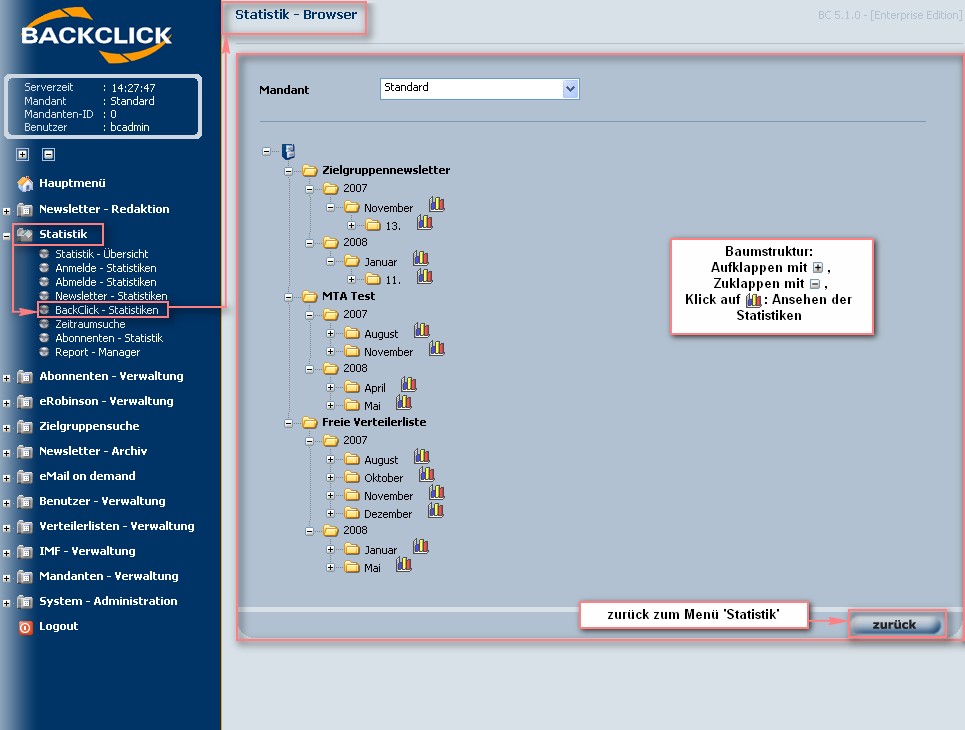
Fig. 3.8.3 - Statistics - Browser